How it works
Find it, underwrite it, buy it, run it.
The same four steps every investor already does. The first three used to be an evening with a spreadsheet.
Step 01 · Find
Stop opening listings to find out they do not work
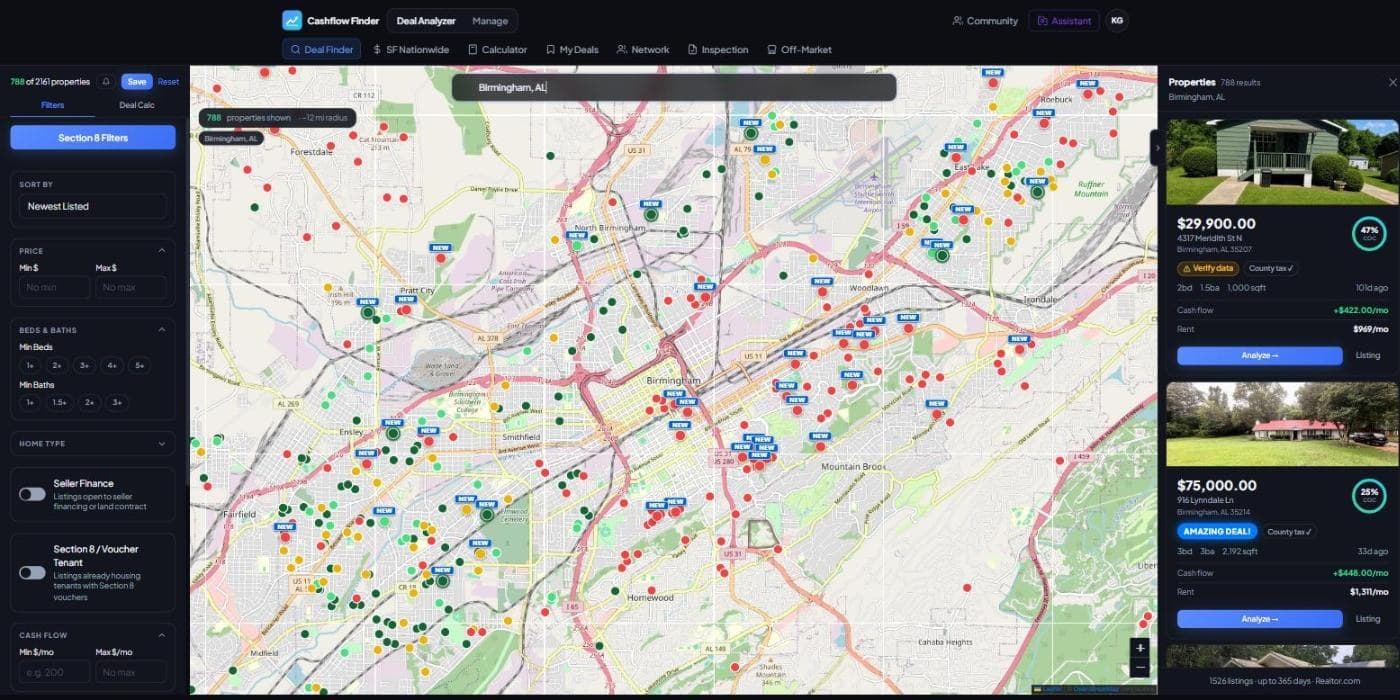
Type a city, a ZIP, or any street address in the country — listed or not. Properties load onto the map already scored: green clears a cash-flow bar, red does not. The county overlay does the same thing one level up, so you can tell whether a market is worth shopping before you shop it.
The filters are the part no general listing site has: seller finance, land contract, or a Section 8 voucher tenant already in place.
Step 02 · Analyze
Underwrite it the way you are buying it
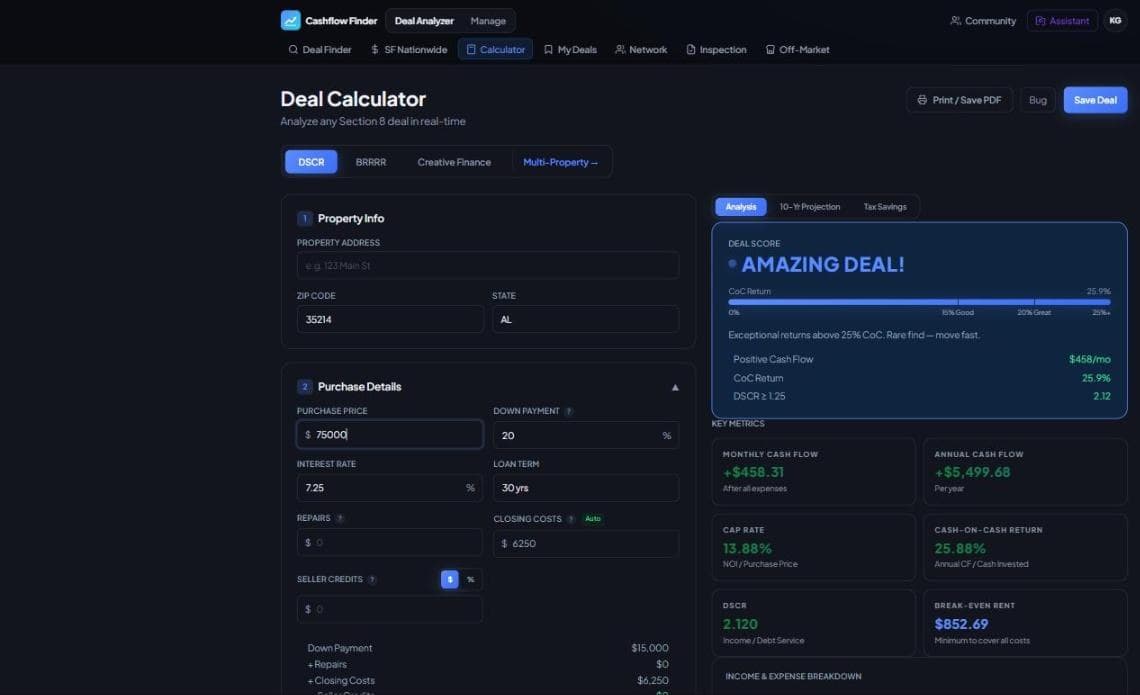
Two plain questions decide the whole model: how you are buying — cash, conventional, DSCR, FHA live-in, or hard money to refinance — and who pays the rent, a market tenant or a housing voucher. Everything downstream follows from those two.
Taxes come off the ZIP effective rate, insurance adjusts per unit, and multifamily is built unit by unit rather than one blended rent.
Rent you do not have to guess
On a voucher deal the rent ceiling is published. Cashflow Finder fills it in from the ZIP — here is the Birmingham-Hoover metro area.
| 1 bedroom | $1,000 |
|---|---|
| 2 bedroom | $1,100 |
| 3 bedroom | $1,380 |
| 4 bedroom | $1,570 |
A worked example
A $75,000 three-bedroom in Birmingham 35214, bought at 20% down on a 7.25% thirty-year loan. Every line below is what the calculator produces.
| Gross rent (HUD payment standard, 3bd) | $1,311 |
|---|---|
| Vacancy (5%) | −$65.55 |
| Mortgage principal & interest | −$409.31 |
| Property tax (ZIP effective rate) | −$31.19 |
| Insurance | −$150.00 |
| Maintenance (5%) | −$65.55 |
| Property management (10%) | −$131.10 |
| Monthly cash flow | +$458.31 |
Illustrative. Not a listing, an offer, or a projection of what any particular property will earn.
Step 03 · Buy
The offer stops living in a notes app
Save a deal from the map or the calculator and it lands on a board. Drag it from Analyzing to Offered to Closed, and generate a letter of intent straight from the card.
The numbers stay exactly as you underwrote them, so six months later you can still see what you thought at the time rather than what the market did since.
Pipeline
- Analyzingnumbers still moving
- OfferedLOI out
- Acceptedunder contract
- Closedmoves to the portfolio
- Passedkept, with why
Step 04 · Manage
Same login, except now you own it
The property moves to the management side: rent roll, repair requests, occupancy, books and entities. Cash in against cash out for the month, and a chase list for whoever is short.
On a voucher property two different payers owe you two different amounts. Every other tool adds them together and calls it rent, which hides the only fact you can act on — so this one keeps them apart.
This month, by payer
Paid on the 1st, direct deposit
Named on the chase list, not buried in a total
Start with one deal
Pull a real listing, drop in the rent, and see what it actually cash flows.
Start free trialOr browse every feature.